Browse Category by Charlotte real estate market
Charlotte real estate market

The market is shifting to buyers – are you prepared?

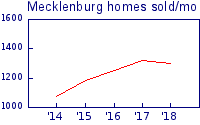
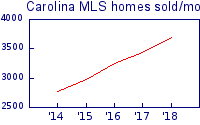
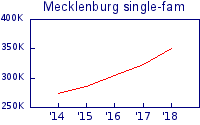
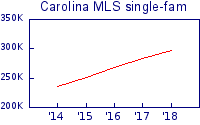
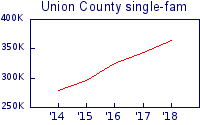
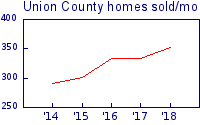
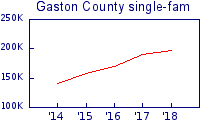
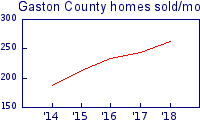
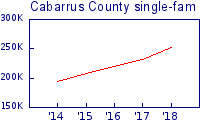
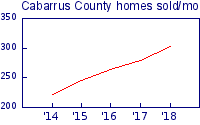
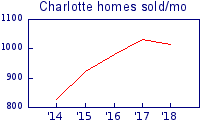
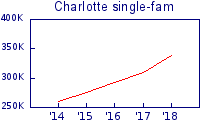
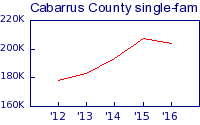
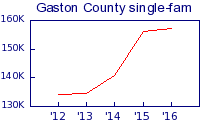
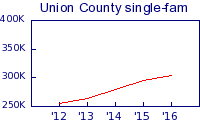
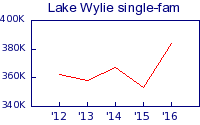
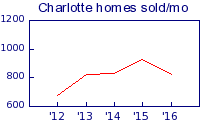
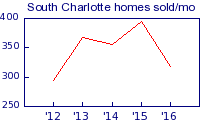
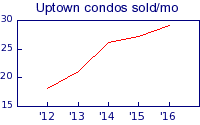
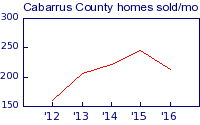
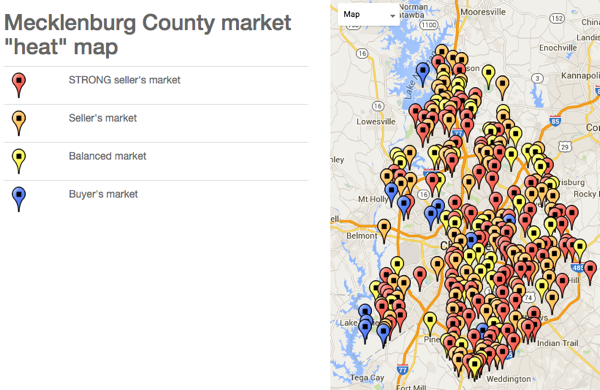
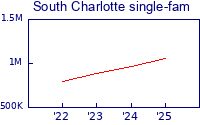
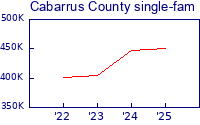
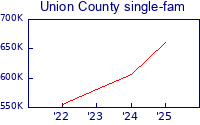
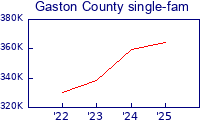
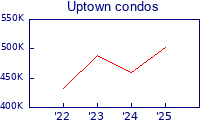
Have you noticed fewer serious buyers roaming the streets?  So have we, in the data.

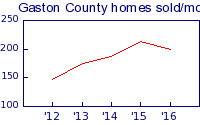
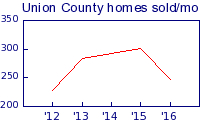
As you can see, the customary drop in sales we see from August-October is noticeably larger this year and the number of homes on the market is higher than it’s been since 2015.

This isn’t panic time — inventory is still low.  That said, the days of “put a $500k house on the market & watch it sell in 2 days” are probably coming to an end.  The public is often behind on the trends and your Sellers might not realize what’s going on (apart from their homes sitting longer than they expected).

So we’d suggest you compile data (like you see here) on what’s going on.  The lack of buyers now means the data you see in the coming months will show an even more stark contract from previous years.

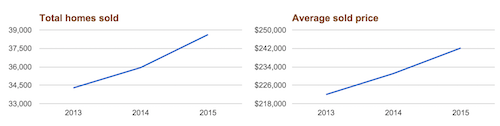
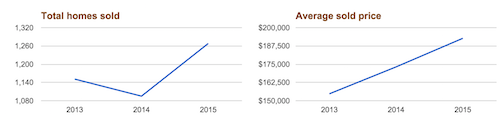
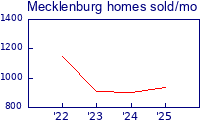
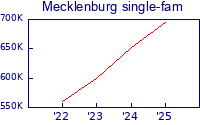
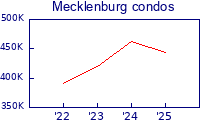
This page updates daily — bookmark it and feel free to download the charts anytime:  Market Trend charts.

Charlotte real estate market

Post-3Q 2018 outlook: Charmeck activity down but prices up everywhere

Taking a look at the real estate market in the Charlotte metro area, one stat sticks out: fewer homes are being sold in Mecklenburg County, while the rest of the region has seen an increase.


Overall activity in the 16-county Carolina MLS area is up about 10% in 2018.  But in Mecklenburg, which represents about 1/3 of the overall market, activity is actually down about 2%.   None of this seems to be impacting prices, however:

Prices have actually increased at a higher rate in Mecklenburg than the rest of the region.  The average home sold in Mecklenburg County in 2018 went for just over $350k.  Yowza!

Let’s look at some other areas:

As you can see, there’s been pretty steady growth, both in activity and price in Union, Gaston, & Cabarrus Counties.  Union saw activity flatten in 2017 but it’s back up this year, to about 350 homes sold per month.  Union County has also seen a nice bump in prices, to slightly above Mecklenburg.

In Charlotte itself, activity has dipped about 3%, but price appreciation remains strong.

Much of the activity discrepancy between Mecklenburg & the surrounding areas probably has a lot to do with just how little inventory there is – about 3.5 months as of this writing.  The outlying areas have a bit more inventory which probably accounts for the uptick in activity.  But appreciation remains strong and it continues to be a very good time to be a seller in the Charlotte metro area.

Charlotte real estate market

The high cost of overpricing

The word is out – we’re in a seller’s market! And lots of sellers understandably want to cash in. But one thing we’re seeing in the data is a STEEP drop from the original sales price when a property doesn’t sell relatively quickly.

As you can see, the average home sold in the first week went for OVER list price. Sold in the first month, the seller came about $10k off the original list price. But over 2 months, and the average drop was almost $40k!

As tempting as it might be to swing for the fences, it’s important for sellers to understand that the longer their property sits, the less money they’ll get (not to mention the extra holding costs).

We have this data available for 5 areas:

These graphs are easily downloadable & will auto-update each week. Feel free to use in your blogs!

Charlotte real estate market

The hottest ‘hoods in Charlotte, 2018 edition

Every so often, we like to run the numbers and compile a list of the hottest neighborhoods in Charlotte (based on inventory).

Remember, a “balanced” market means about 6 months inventory. So if a neighborhood is under 4 months or so, that’s a seller’s market. It means there are buyers waiting for listings to come on the market, and sellers are often selling their houses quickly and for more money than they expected.

Here are a few examples of very hot neighborhoods:

  • Sherwood Forest (0.4 month supply)
  • Stonehaven (1.2 months supply)
  • Beverly Woods (1.5 months supply)
  • Madison Park (1.7 months supply)
  • Monteith Park (0.5 month supply)
  • Tanners Creek (1 month supply)
  • Cedarfield (1.7 months supply)

So, without further adieu, here are the lists!

Charlotte real estate market

Freddie Mac tabs Charlotte as ‘healthy’ market

One of our clients wrote a pretty cool blog about Freddie Mac adding Charlotte to its list of markets whose “Multi-Indicator Market Index” falls in a healthy range.

In a nutshell, this Freddie Mac indicator tells us how “normal” a market is in comparison its long-term range.  If its “MiMi” valls between 80 & 120, it’s deemed “in range” by Freddie Mac.  Anything under 80 is a slow market and anything over 120 is one where the market is too hot to be considered healthy.

One thing that was interesting from this data, available on our client’s website is that the actual market bottom in Charlotte occurred in September, 2011.  So if you bought a house around then, congratulations because it’s almost certainly worth a heck of a lot more today!

Thanks to Donna Johnson of RE/MAX Executive for sharing this info!


Charlotte real estate market

Charlotte market update 1Q 2016: prices up, activity down

We’re about a month into the 2nd quarter of 2016, so it’s safe to start drawing some conclusions the market.  Let’s dive in…

Charlotte single family avg price southcharlotte-res Uptown Charlotte condos - average price lkn-res cabarrus-res gaston-res Union County NC average price lkw-res

Overall, prices are slightly up.  Uptown condos have seen a bit of a dip, along with homes in Cabarrus county. The average South Charlotte home is now about $430k, 5% up from last year.  Because the region has very low inventory (about 4 months in Charlotte), buyers are paying a premium for desirable properties.

But the other side of the coin of low inventory is lower activity:

Charlotte single family sales per month South Charlotte homes sold per month Uptown Charlotte condos - sales permonth Cabarrus county homes sold per month Gaston county homes sold per month Union county homes sold per month
A few more uptown condos are selling each month compared to 2015, but overall, activity is down about 15% in the region as a whole.

This number should improve as we get through the summer months, but we expect activity to be down in 2016 due to the lack of local inventory across the board and the dip in home ownership we’ve seen over the past few years.  US home ownership peaked at almost 70% before the economic collapse and has been falling.  It’s down to about 63% today.

While low inventory can cause headaches for buyers, we aren’t seeing big spikes in prices or anything too alarming.  At 4.5 months, we are definitely in a seller’s market, but it’s nothing like what we saw pre-crash.  In a sense, fewer buyers looking is a good thing because it keeps the market more in balance.

Charlotte real estate market

2015 annual market report is here!

We’ve been hard at work with our calculators & abacuses and have completed the 2015 “state of the market” for the Charlotte region.

Overall, MLS activity was up 7% and prices were up 5% over 2014.

Charlotte market report 2015

One area that stood out, however, was East Mecklenburg, where activity was up a whopping 18% and prices were up 11%.

East Mecklenburg market report 2015

As a whole, 2015 was a very good year for the entire region.  We made this report available on all our clients’ sites, but you can also view it here.


Charlotte real estate market, Getting leads

Charlotte/Mecklenburg mid-2015 market update

Yowza, it’s been over 6 months since we’ve blogged!  So much for leading by example, eh?  Let’s try to make up for it with some rock-solid analysis of the Charlotte market.

Mecklenburg county homes sold per month   Mecklenburg county avg price   Mecklenburg county condos avg price

Now that’s a healthy market. But how about some areas within Mecklenburg?

south charlotte homes avg price cabarrus homes avg price union homes avg price gaston homes avg price uptown condos avg price

Okay, so Union County has seen a slight decrease from 2014, but other than that, there isn’t a shred of bad news in here!

Screen Shot 2015-06-25 at 4.01.04 PM


Both Charlotte & Mecklenburg County are sitting with just over 5 months of housing inventory.  That means in many areas we are in a full-blown seller’s market.   There are a whole lot of subdivisions with fewer than 4 months of supply:  Collins Park, Barclay Downs, Sedgefield, Merry Oaks, Elizabeth, Madison Park, and Chantilly, just to name a few.

If there are sellers in there considering selling, now is a great time.  Or, so says the postcards you should be sending…  😉

It’s been quite some time since we’ve seen seller’s markets, so enjoy it!  Even the areas with high inventory are typically not more than 9 or 10 months.  Just a few years ago, 9 months inventory would have been considered very good.

Have a great summer and party like it’s 2005!

Charlotte real estate market

2013 home values in metro Charlotte: up, up, up!

With the 3rd quarter in the books, let’s take a look at how 2013 has looked:


Now those are some nice charts, eh?  The biggest gains are in the city of Charlotte & Mecklenburg County – both are up over 10% from 2012!

Even condos aren’t doing too badly:


Overall, condos are up 8-10% from 2012 in Charlotte/Mecklenburg, and we’re seeing minimal gains in most areas other than uptown:

However, though uptown condo values are down, activity is up:

As always, feel free to steal these graphs and let us know if you have questions, or if there’s any data we can crunch for you!