Charlotte real estate market

2018 market report: Charlotte up 8%!

Our annual Charlotte market report is hot off the presses and the main story is that in 2018, the average single-family home in the city of Charlotte went for over $330k!  That is up 8% from 2017 and a whopping 15% from 2016.

However, we are seeing less activity, as we’ve reported in the past.  Buyers are more scarce, and while inventory is still very low, there’s reason to believe 2019 will start moving in the direction of a buyer’s market, especially with the Fed expected to continue to raise interest rates.

But in terms of prices, that isn’t a reason to worry, at least at this point.  Check out North Mecklenburg, for example:

North Meck (including Huntersville) is up over 10% in 2018 after seeing only a slight increase in 2017.  But like most areas, activity is down.

So, what are you waiting for?  We have data for all MLS areas along with subdivisions/condos.  Feel free to use any/all of this for your blogs & social media.  You won’t find it anywhere else!

Charlotte real estate market

The market is shifting to buyers – are you prepared?

Have you noticed fewer serious buyers roaming the streets?  So have we, in the data.

As you can see, the customary drop in sales we see from August-October is noticeably larger this year and the number of homes on the market is higher than it’s been since 2015.

This isn’t panic time — inventory is still low.  That said, the days of “put a $500k house on the market & watch it sell in 2 days” are probably coming to an end.  The public is often behind on the trends and your Sellers might not realize what’s going on (apart from their homes sitting longer than they expected).

So we’d suggest you compile data (like you see here) on what’s going on.  The lack of buyers now means the data you see in the coming months will show an even more stark contract from previous years.

This page updates daily — bookmark it and feel free to download the charts anytime:  Market Trend charts.

Charlotte real estate market

Post-3Q 2018 outlook: Charmeck activity down but prices up everywhere

Taking a look at the real estate market in the Charlotte metro area, one stat sticks out: fewer homes are being sold in Mecklenburg County, while the rest of the region has seen an increase.


Overall activity in the 16-county Carolina MLS area is up about 10% in 2018.  But in Mecklenburg, which represents about 1/3 of the overall market, activity is actually down about 2%.   None of this seems to be impacting prices, however:

Prices have actually increased at a higher rate in Mecklenburg than the rest of the region.  The average home sold in Mecklenburg County in 2018 went for just over $350k.  Yowza!

Let’s look at some other areas:

As you can see, there’s been pretty steady growth, both in activity and price in Union, Gaston, & Cabarrus Counties.  Union saw activity flatten in 2017 but it’s back up this year, to about 350 homes sold per month.  Union County has also seen a nice bump in prices, to slightly above Mecklenburg.

In Charlotte itself, activity has dipped about 3%, but price appreciation remains strong.

Much of the activity discrepancy between Mecklenburg & the surrounding areas probably has a lot to do with just how little inventory there is – about 3.5 months as of this writing.  The outlying areas have a bit more inventory which probably accounts for the uptick in activity.  But appreciation remains strong and it continues to be a very good time to be a seller in the Charlotte metro area.

Charlotte real estate market

The high cost of overpricing

The word is out – we’re in a seller’s market! And lots of sellers understandably want to cash in. But one thing we’re seeing in the data is a STEEP drop from the original sales price when a property doesn’t sell relatively quickly.

As you can see, the average home sold in the first week went for OVER list price. Sold in the first month, the seller came about $10k off the original list price. But over 2 months, and the average drop was almost $40k!

As tempting as it might be to swing for the fences, it’s important for sellers to understand that the longer their property sits, the less money they’ll get (not to mention the extra holding costs).

We have this data available for 5 areas:

These graphs are easily downloadable & will auto-update each week. Feel free to use in your blogs!

Charlotte real estate market

The hottest ‘hoods in Charlotte, 2018 edition

Every so often, we like to run the numbers and compile a list of the hottest neighborhoods in Charlotte (based on inventory).

Remember, a “balanced” market means about 6 months inventory. So if a neighborhood is under 4 months or so, that’s a seller’s market. It means there are buyers waiting for listings to come on the market, and sellers are often selling their houses quickly and for more money than they expected.

Here are a few examples of very hot neighborhoods:

  • Sherwood Forest (0.4 month supply)
  • Stonehaven (1.2 months supply)
  • Beverly Woods (1.5 months supply)
  • Madison Park (1.7 months supply)
  • Monteith Park (0.5 month supply)
  • Tanners Creek (1 month supply)
  • Cedarfield (1.7 months supply)

So, without further adieu, here are the lists!

Getting leads, Tech trends

Mastering lead distribution and conversion

Lead generation is vital to your business, but once you generate leads, are you doing a good job converting them?

When a prospective buyer sends an inquiry via your website, if you’re not responding quickly (preferably within 15 minutes) to that inquiry, your chance of converting that lead suffers.

One of the most common problems we see with firms (or teams of agents) is a lack of accountability with lead responses.  Leads will get assigned and there’s no telling which agents are responding quickly (if at all).

With this in mind, we were thrilled to stumble on some really cool new technology: LeadRobin.  This product automates lead distribution and allows you to monitor agent performance.

LeadRobin allows you to set up rules for lead distribution, such as “Dilworth subdivision, price over $300k” and then set up lists of agents to receive those leads.  A lead is distributed to “Agent A” and if that agent doesn’t answer the lead within a given time frame (say, 15 minutes), the lead goes to “Agent B,” and so on.

LeadRobin lets you monitor your agents to see who is failing to answer leads & who is the fastest responder.

This is an indispensable tool in today’s market, when buyers demand FAST responses.  Even 1 missed lead could cost you thousands of dollars.  LeadRobin starts at $50/month, which is a small price to pay to ensure that no leads are missed.

Charlotte real estate market

Freddie Mac tabs Charlotte as ‘healthy’ market

One of our clients wrote a pretty cool blog about Freddie Mac adding Charlotte to its list of markets whose “Multi-Indicator Market Index” falls in a healthy range.

In a nutshell, this Freddie Mac indicator tells us how “normal” a market is in comparison its long-term range.  If its “MiMi” valls between 80 & 120, it’s deemed “in range” by Freddie Mac.  Anything under 80 is a slow market and anything over 120 is one where the market is too hot to be considered healthy.

One thing that was interesting from this data, available on our client’s website is that the actual market bottom in Charlotte occurred in September, 2011.  So if you bought a house around then, congratulations because it’s almost certainly worth a heck of a lot more today!

Thanks to Donna Johnson of RE/MAX Executive for sharing this info!


Charlotte real estate market

Charlotte market update 1Q 2016: prices up, activity down

We’re about a month into the 2nd quarter of 2016, so it’s safe to start drawing some conclusions the market.  Let’s dive in…

Charlotte single family avg price southcharlotte-res Uptown Charlotte condos - average price lkn-res cabarrus-res gaston-res Union County NC average price lkw-res

Overall, prices are slightly up.  Uptown condos have seen a bit of a dip, along with homes in Cabarrus county. The average South Charlotte home is now about $430k, 5% up from last year.  Because the region has very low inventory (about 4 months in Charlotte), buyers are paying a premium for desirable properties.

But the other side of the coin of low inventory is lower activity:

Charlotte single family sales per month South Charlotte homes sold per month Uptown Charlotte condos - sales permonth Cabarrus county homes sold per month Gaston county homes sold per month Union county homes sold per month
A few more uptown condos are selling each month compared to 2015, but overall, activity is down about 15% in the region as a whole.

This number should improve as we get through the summer months, but we expect activity to be down in 2016 due to the lack of local inventory across the board and the dip in home ownership we’ve seen over the past few years.  US home ownership peaked at almost 70% before the economic collapse and has been falling.  It’s down to about 63% today.

While low inventory can cause headaches for buyers, we aren’t seeing big spikes in prices or anything too alarming.  At 4.5 months, we are definitely in a seller’s market, but it’s nothing like what we saw pre-crash.  In a sense, fewer buyers looking is a good thing because it keeps the market more in balance.

Charlotte real estate market

2015 annual market report is here!

We’ve been hard at work with our calculators & abacuses and have completed the 2015 “state of the market” for the Charlotte region.

Overall, MLS activity was up 7% and prices were up 5% over 2014.

Charlotte market report 2015

One area that stood out, however, was East Mecklenburg, where activity was up a whopping 18% and prices were up 11%.

East Mecklenburg market report 2015

As a whole, 2015 was a very good year for the entire region.  We made this report available on all our clients’ sites, but you can also view it here.


Getting leads, Tech trends

The complete idiot’s guide to getting Internet leads in real estate

Over the past decade, we’ve worked with hundreds of agents and seen a whole lot of different tactics to get Internet leads.  Since “how do I get leads?” is the most popular question we hear from clients, we’ll lay everything on the table for you.

There are 2 distinct ways to get Internet leads and we will go over the pros & cons.

PROs CONs
Buy leads from sources such as Trulia/Zillow, Realtor.com, etc.
  • Fast results
  • No need to generate your own content
  • Expensive
  • Depending on your area, lead quality might be bad
Develop your own Internet content and attract organic search traffic
  • Sustainable long-term without spending big bucks
  • Leads tend to be higher quality
  • Harder work
  • Results can take time

As a general rule, developing your own content & getting organic traffic is the best long-term strategy.  It’s a LOT cheaper over the long run, and the quality of the leads are significantly better.  We asked a current client of ours to describe her experience buying leads and here’s what she said:

Trulia/Zillow was a huge waste of money for me.  I did a 6-month campaign and spent about $1500 and literally the only leads I got were for rentals or for homes that sold 2 years ago.  What you’re buying with Trulia/Zillow is placement on their property pages so that if a buyer finds the house, your name shows up in the top 3.  But for whatever reason, I didn’t get a single lead on a real house for sale in 6 months.

Realtor.com was a little better — they scrub their leads so that you’re getting a real email address & phone number and they guarantee a certain number of leads per month.  But it’s pricey and most of the leads I got were for houses under $100k.

Writing good, quality content (and lots of it) on your own website is definitely harder work, and quite frankly a lot of agents would PREFER to throw hundreds of dollars a month at Trulia/Zillow with the hope that they’ll get a decent lead or two.  But without any doubt, our most successful clients are the ones who put the time/effort into building their own Internet presence, with good local content.

So what do I do?

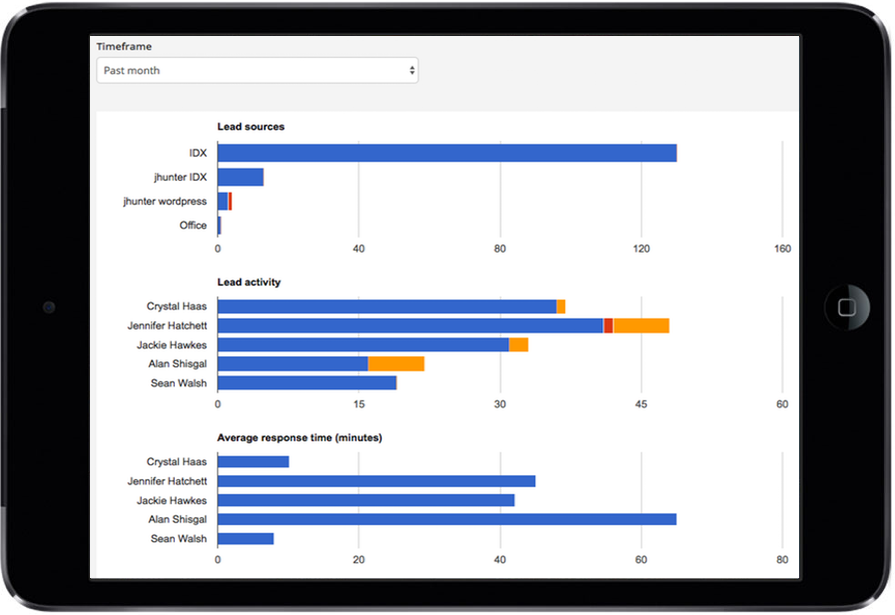
Believe it or not, about 85% of what you need to do is pretty much common sense.  Start a website.  Have an IDX/property search that captures leads.  Write blog posts with good LOCAL content at least 2 or 3 times per week.  Then use Facebook / Twitter to drive traffic to those blog posts.  Rinse, repeat!

There are certain techniques that can help raise your rankings but in general, it’s all about content.  CONTENT, CONTENT, CONTENT!

We’ve said it again & again.  There is no secret or magic bullet to getting Internet leads.  It requires hard work & patience, and the agents who put in the time/effort to attract traffic are the ones who get the leads.