

Posted via email from Charlotte real estate technology, IDX, market data


Posted via email from Charlotte real estate technology, IDX, market data
As expected, activity was up in June : there were about 11% more closings than there were in May. But perhaps surprisingly, the average price of homes sold in June was also up : by about 8%! Here’s a chart (note, you can ignore the July data, which is still very incomplete) :
Posted via email from Charlotte real estate technology, IDX, market data
The news came out yesterday : home sales from April to May plummeted after the expiration of the home buyer tax credit. The numbers were as bad as they’ve been since the Commerce Department started tracking this data in 1963.
I probably had 5 or 6 friends give me this news in one way or another, and then the talking heads on TV dissected it ad nauseam. So, naturally I had to see what the story is locally in the Charlotte area.
Sales dropped from April to May, but only about 5%. However, over that same period, the average price of those sales rose by about 4%! Note that the graph we’re attaching shows June data, but it is still incomplete (the data is through June 23).
We’ve been hearing bad news in our business for about 2 years now, but it’s critical to remind your clients that market stats are a local thing. Things might be awful in one area of the country, but that doesn’t mean they’re as bad here in Charlotte. The fact is, we never saw a value “spike” here like they saw in many areas (such as Florida and California) and so prices have been rather stable, even in the face of a recession.
So, get on the horn and reassure your clients, and feel free to use our graphs if they’ll help.
Posted via email from Charlotte real estate technology, IDX, market data
The infamous tax credit expired on April 30, and now the question is how many closings will we see, and what “move up” buyers will do after they sell their homes to buyers who took advantage of the tax credit.
Without further adieu…

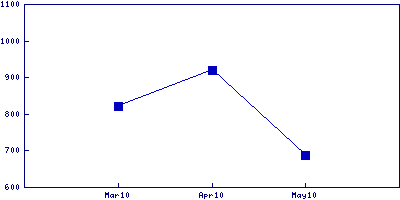
Houses+condos sold per month in Mecklenburg County

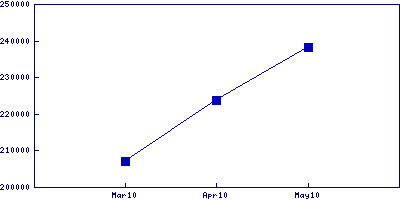
Average price of houses+condos sold in Mecklenburg County
As you can see, it’s a mixed bag. As of now (June 1, 2010), some of the sales from May might not have been reported yet, so it’s possible that number of 688 houses+condos sold in May will go up. But given how “thorough” most lenders are these days, it’s not entirely surprising that people who went under contract in late April might not have closed yet.
But the increase in average price certainly shows that values in the area are quite stable. As we’ve written before, Charlotte hasn’t seen the massive drops in value that other areas have seen, but activity remains low.
Certainly, with more “tax credit” closings to occur in the next 30 days, there is hope that some “move-up” buyers will start hitting the market in the next quarter. Fingers crossed!
I’ve got good news and bad news… what do you want first?
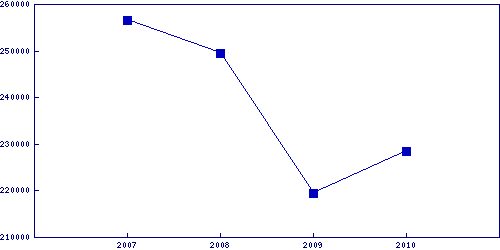
Okay, the good news. Compared to other hard-hit areas of the country, Charlotte has not seen prices go down very much. The average single-family home sold in Mecklenburg County so far in 2010 went for $228k. This represents only about a 10% drop from 2007 (when the average house went for $256k), or an average of 3.33% per year. Not only that, but prices in 2010 are higher than 2009, when the average house sold was $219k (a 4% gain!). Compare that to some parts of Florida, for example, which have seen drops of 30% or more since the peak.
Here is a chart:

Unfortunately, there is a down side : activity. In 2007, an average of 1,260 houses sold each month in Mecklenburg. By 2009, only about 600 houses sold per month and thus far in 2010 we are averaging under 450 houses sold per month.
Here’s a chart tracking monthly sales since 2007:

Consider that for a moment … a 64% drop in monthly sales since 2007! It’s staggering! Given current absorption, we have almost 4 years of inventory on the market.
So what does all of this mean?
It might be logical to conclude that Charlotte’s home prices have to drop before we’ll see a lot of activity again. But if that were true, why have we seen 4% higher prices in homes sold in 2010? It’s a mixed bag. On one hand, because there never was a big “spike” in Charlotte, it’s reasonable to conclude that the market was not that overvalued, even at the peak in 2007. But on the other hand, where are the buyers?
Like many things these days, it might very well come back to the banks and current lending policies. Anyone intending to purchase a property as anything other than a primary residence has a very difficult time getting a mortgage, regardless of credit score or income. This removes a big chunk of would-be buyers, and is keeping inventory high. On top of that, “move-up” buyers who own a home cannot typically buy another house until they sell their current one. And not only are first-time home buyers more timid than usual these days, but they, too, are dealing with a tight credit market. They need a big down payment and with the media hysteria, many are holding out for a “deal.” But since prices, on average, haven’t dropped much in Charlotte, this means a lot of low-balling, and sellers having to face the choice of being stuck with their house, or having to bring money to closing.
It boils down to confidence. When banks are more confident in the recovery, (hopefully) their lending policies will become a bit more friendly to investors, who are a key element in a healthy real estate market. But also, home buyers need to be confident that their job is not in jeopardy and the value of their newly-purchased home is not going to plummet.
In the end, Charlotte is very lucky to not be looking at the massive drops in value that so many other areas of the nation are seeing. It’s very much a “choose your poison” proposition… would you rather have stable prices with low activity, or much lower prices with more activity? Hopefully as the recovery continues, Charlotte-area REALTORS won’t have to make that choice.
If you’ve been watching the news at all in the past year, you know that in most areas, the real estate market isn’t in great shape. To say that it’s a buyer’s market right now is like saying the Pacific Ocean has some water in it.
But what, exactly, is going on, and what does it mean to you & your house? I’m going to demystify this for the average home seller, so you know what you’re up against. Here’s a hint… it’s mostly about the banks.
We all know that getting a mortgage is very difficult these days, and what this means is that the only people who can buy right now are folks that banks consider to be virtually zero risk. On its face, this isn’t a terrible thing, considering how crazy things got a few years ago. But it means a whole lot of buyers have been eliminated. Let’s consider:
1) Real estate investors, or anyone who owns rental property.
At first, you might be thinking, “this doesn’t apply to me — my house isn’t in an area with a lot of rentals.” But realize that if investors can’t buy, that means that a lot of the “deals” out there aren’t being snapped up, and regular buyers are going for them (i.e. foreclosures, short sales, etc). That leaves many conventional sellers on the outs, waiting for the “deals” to go away. With no banks lending to investors, there’s nobody to buy them.
On top of that, regular people who happen to own a rental property or two are out in the cold. Why? Because these days, banks aren’t “counting” rental income towards the bottom line, and so if there’s a mortgage on any of the rental properties, the banks are counting it against the person’s debt/income ratio without counting the income! That makes it difficult (or impossible) for those buyers to get a mortgage, even if they have good credit/income/assets.
2) “Move up” buyers
Buyers who already own a home can no longer get the type of “bridge” financing they used to be able to get, and further, if they decide to lease their current house so they can buy another, see above … the banks won’t count the rental income! That leaves them stuck.
So if you own a house in the “move-up” market (typically $300-500k), this is killing you right now. Potential buyers are hamstrung because they themselves have a house they can’t sell.
So, who’s left? Basically the only person who can get financing these days is a conventional buyer who has no existing mortgage. This means they either own their current home outright, or are renting. By and large, this means first-time home buyers.
First-time home buyers are normally timid, but even doubly so these days. Even though in many areas, this is the best buyer’s market we’ve seen in a long time, first-timers are worried about potentially losing their job, or buying before the market hits bottom. So many are sitting on the sidelines, or out looking, but being extremely picky.
If you’re selling right now, you might have noticed that buyers are nitpicking virtually everything. Here is why. Buyers have so many homes to choose from (partially because there’s no competition from investors right now) so they figure they can wait until they find the Taj Majal for $99k.
If you’ve read this far, you’re probably pretty depressed. It’s indeed very ugly out there right now, and unless you have a flawless property at a great price, it’s challenging to sell in this climate. But don’t despair… things will get better, and possibly sooner than later.
Banks have to start lending eventually. Right now, banks are making all their money on refinances… one after another. Demand is high and risk is low. But eventually rates will rise or demand will slow (or both). And then they are in a pickle. And somewhere, some smart banker will realize that there is massive investor demand and slowly the spigot will open for responsible, creditworthy investors.
When this happens, competition will become fierce for the “deals,” and conventional buyers will have fewer homes to choose from. At that point, more of the “first-time” market will start to turn, and eventually the “move-up” market. And once other banks start seeing their competition making money on responsible investor loans, it’ll snowball.
So in a sense, this is a cautionary tale for buyers … don’t wait too long. And if you’re a seller with a good house at a reasonable price, you will sell.