If you’re an existing client of ours, you get this neat absorption tool, for free… check it out!
Browse Author by davisfarrell
End-of-September Carolina MLS market update
Fall is in the air, football season is here… it must be October in Charlotte! But most importantly, how’s the real estate market?
As you might expect, activity has continued to slow since June and the homebuyer tax credit.

Just under 1,300 homes sold in Carolina MLS in September. That’s just over half as many as the 2,550 that sold in June, and about 350 (~20%) fewer than in August. For a little statistical fun (or just if you are in too good a mood today), compare to June, 2007, when a whopping 4,200 homes sold in Carolina MLS! Crazy!
But as we’ve pointed out before, while our activity has markedly dropped over the past couple of years, prices have been relatively stable.
September saw a bit of a dip in price, with the average home going for about $206k, about 6% less than in August. But consider at the market peak in 2007, the average home sold only went for about $230k, so even a bad September is still only about 10% off the peak. And overall, 2010 is still better than 2009 in both activity AND price.

So as we’ve pointed out for several months, 2009 really, REALLY looks like a bottom! If this trend holds, hopefully more of those jittery buyers will come out of the woodwork next spring.
Posted via email from Charlotte real estate technology, IDX, market data
2007 vs. 2010: what has changed?
In terms of home prices and activity, 2007 represented the peak in metro Charlotte: about 1,250 homes sold per month in Mecklenburg that year, at an average price of $257k. This year, about 725 houses a month are selling in Mecklenburg, at an average price of $241k. The prices have only dropped about 6% since the peak, but activity is down about 40%.
These numbers probably don’t look too unfamiliar, so we decided to delve deeper. Looking at the sold properties from both 2007 and 2010, what trends can we identify?
The first one, you could probably guess. In 2007, the “under $200k” price bracket represented 58% of the homes sold in Mecklenburg. The $200-500k range was 35% of homes sold, and the last 7% was homes over $500k.

“Sold” price ranges: 2007
In 2010, interestingly, one of these percentages is identical : the over $500k range! But homes under $200k are up to 63% of homes sold, and that 5% gain came entirely from the $200k-$500k range, which is down to 30% of homes sold.

“Sold” price ranges: 2010
Other than that 5% “swap” between price ranges, what else is different? Frankly, not much! We examined the MLS areas, and found the sales patterns were almost exactly the same. Area 1 had the most sales in both 2007 and 2010, representing 19% of homes sold in Mecklenburg, followed by Areas 5, 2, 9, 4, and 3. The percentages stayed virtually the same, with a few of the areas moving by at most 1%. Areas 5 and 7 were down by 1%, and Areas 2 and 3 were up by 1%. But otherwise, everything was almost identical.
| Area | 2007 | 2010 |
|---|---|---|
| 1 | 19% | 19% |
| 5 | 16% | 15% |
| 2 | 13% | 14% |
| 9 | 10% | 10% |
| 4 | 9% | 9% |
| 3 | 8% | 9% |
| 7 | 8% | 7% |
| 8 | 7% | 8% |
| 6 | 5% | 5% |
So what’s to conclude? Honestly, these numbers show that Charlotte is experiencing many of the same trends as other areas, but unlike some of the hard-hit areas, prices are very stable here. For prices to have only dropped 6% from the peak is almost remarkable in these times. If you have any REALTOR friends in Florida or Nevada, ask them how low prices are now compared to the peak, and you will hear percentages like 20 or 30%.
Until next time… Happy Labor Day!
Posted via email from Charlotte real estate technology, IDX, market data
Almost end-of-summer Carolina MLS market report
If you’ve been watching the news lately, you’ve seen the national numbers: home sales are way down since June 30 (and the end of the home buyer tax credit). But as a good REALTOR, you know that markets are local — so what’s the story here in Charlotte?


As you may know, about 33% fewer homes were sold in July than were sold in June in CMLS. And there was another drop-off in August, but not a very big one — 14% fewer homes sold in August than sold in July (though August’s sales represent a 44% drop from June).
Prices, however, continue be stable in our region. Despite the lower activity in July, prices actually rose about 4%, though they fell back to near June levels in August.
Looking at the long view, 2010 still is a better year and continues to make 2009 look like “the bottom.” In 2008, about 2,300 homes sold per month in CMLS. That dropped to 1,650 in 2009, and thus far in 2010 is at 1,850 per month.
The price chart over that time span looks similar: the average home in 2008 sold for $220k. That dropped to $199k in 2009 and is up to about $210k this year. It also bears mentioning that at our peak in 2007, the average price of homes sold was $231k, which is only a $20k difference from today, which represents only about an 8.6% difference. Ask the folks in Florida or Nevada if they’d take an 8.6% drop…
Overall, tight credit and jittery buyers is preventing more folks from hitting the pavement to buy a house, but all in all, the Charlotte market is as healthy as you could ask for given the economic crash we witnessed in 2008. With the summer about over, we can probably expect the sales numbers to drop some more, but we still suspect 2010 will stay ahead of 2009. So if you have buyers who are trying to “time the market,” these graphs sure make 2009 look like a bottom!
Until next time… thanks for reading!
Posted via email from Charlotte real estate technology, IDX, market data
The market within the market: price ranges
One of the things we frequently hear from some agents is that certain price ranges are tougher to move these days than others. One of our clients was telling us that she has no problem selling homes in the under-$200k range, but most of her listings over $200k (even ones priced very aggressively for their areas) are not getting showings.


So, we figured we’d check the numbers to see if this is a trend in Charlotte. And sure enough, there is some validity to it.
Of the ACTIVE single-family homes on the market now, 51% of them are priced under $200k. 37% are between $200k-500k and 12% are over $500k. Here’s a chart:
Compare to the SOLDS in 2010, where 63% them were under $200k, 30% were between $200k-500k and only 7% were over $500k.
Indeed, houses under $200k make up a larger percentage of solds than they do of actives. That difference of 12 percentage points means that there are 23% more homes in the sub-$200k price range in “solds” than there are in “actives.”
While there is a lower percentage of $200k-$500k homes that have sold, the percentage difference is 19%, so the negative impact on that range is not as large as the positive impact on the under-$200k range.
Where we see the greatest hit is to the over-$500k range, where there are a whopping 42% more active homes in that price range than they are “solds” in 2010.
Overall, it’s important to remember that Charlotte is doing quite well compared to many markets in the US, and based on the numbers in 2010, 2009 is looking more and more like the true “bottom.” As you can see, activity is slightly up in 2010 (even including July’s numbers, which were down due to the expiration of the tax credit), and sales prices are about 4% higher than 2009.

And that’s the nerdy real estate stats talk for today!… Happy weekend!
Posted via email from Charlotte real estate technology, IDX, market data
A tale of two lakes: LKN/LKW market stats
There’s no denying that it’s been a tough market in Lake Norman & Lake Wylie. Of all the major CMLS areas, 13 (LKN) and 15 (LKW) have the most inventory (based on absorption rate) — in fact, they are almost identical at 17.8 months. But looking inside the numbers, we see some interesting trends.


First, we look northward to Lake Norman:
Monthly sales activity is actually up about 10% from 2009, which sets it apart from most of CMLS, where prices are up, but activity is down. Thus far in 2010, about 63 houses are selling per month, compared to about 57/mo in 2009.
However, unlike the rest of CMLS prices in 2010 are flat compared to 2009 — down about half a percent. The average house in 2010 sold for $466,800, compared to $468,300 in 2009. Still, it’s only down 1.5% from 2008.
Now, let’s examine Lake Wylie:
It’s actually a very similar trend to Lake Norman! Monthly sales activity is up, but by a whopping 15%! In 2009, about 21 houses per month sold in LKW, but in 2010 that number is up to almost 25.
But unlike LKN, prices are up in Lake Wylie for 2010, by about 7%. However, compared to 2008, prices are down about 12% — a much larger drop than Lake Norman.
It’s important to remember that Lake Wylie has fewer homes than Lake Norman, so the sample is smaller. But it’s almost eerie how similar these trends are, given that these two lakes represent very different areas of metro Charlotte. However, the activity increase from 2009 is encouraging, given that most other areas of CMLS are seeing less activity this year.
Posted via email from Charlotte real estate technology, IDX, market data
Assessing June market data & watching for ‘move-up’ buyers
The 4th of July weekend is in the books, and we can now start to assess the “tax credit” closings in June and take a look at where the market is headed.
As expected, activity was up in June : there were about 11% more closings than there were in May. But perhaps surprisingly, the average price of homes sold in June was also up : by about 8%! Here’s a chart (note, you can ignore the July data, which is still very incomplete) :

So, where are we compared to previous years? In 2009, 1,655 homes sold per month, and so far in 2010 that number is about 1,600. If post-tax credit activity continues to be slow, then 2010 will probably not surpass 2009 in activity. However, thus far in 2010, the average price of homes sold is up by about 3%.

The big question remaining in 2010 is whether those people who sold to the “tax credit” buyers in May/June are going to go back out & buy another house this summer. Mortgage rates are at a historic low, and given the media’s daily hammering of how bad the market is, anyone in a position to buy is might find themselves in what might be the best buying environment in a generation.
Metro Charlotte has simply not seen the massive housing collapse (in terms of prices) that other areas of the country are experiencing, and other than low activity (closings per month in 2010 are roughly half what they were at the peak, in 2007), you’d be hard pressed to find a “safer” market than Charlotte, given the economic storm that the area has weathered.
So, let’s cross our fingers that a bunch of those 4,000+ homeowners who were able to sell in May and June get back out this summer to find a good “move-up” home.
Posted via email from Charlotte real estate technology, IDX, market data
Don’t be scared of the big, bad anchorman… home sales not so bad in Charlotte area
The news came out yesterday : home sales from April to May plummeted after the expiration of the home buyer tax credit. The numbers were as bad as they’ve been since the Commerce Department started tracking this data in 1963.
I probably had 5 or 6 friends give me this news in one way or another, and then the talking heads on TV dissected it ad nauseam. So, naturally I had to see what the story is locally in the Charlotte area.

Sales dropped from April to May, but only about 5%. However, over that same period, the average price of those sales rose by about 4%! Note that the graph we’re attaching shows June data, but it is still incomplete (the data is through June 23).
We’ve been hearing bad news in our business for about 2 years now, but it’s critical to remind your clients that market stats are a local thing. Things might be awful in one area of the country, but that doesn’t mean they’re as bad here in Charlotte. The fact is, we never saw a value “spike” here like they saw in many areas (such as Florida and California) and so prices have been rather stable, even in the face of a recession.
So, get on the horn and reassure your clients, and feel free to use our graphs if they’ll help.
Posted via email from Charlotte real estate technology, IDX, market data
Content is king: spread your knowledge, drive traffic
When we started in this business in 2005, getting Internet leads was much easier by comparison because there just wasn’t as much competition out there. But now, virtually every real estate agent on planet Earth has at least 1 website, and are vying for the same buyers you are. Here are some tips to stay ahead of the crowd!
1) Create searches and post them!
Got a few minutes of down time? Go to your IDX, do a search, and copy & paste the URL into Facebook/Twitter/your blog, etc.
Example: Did you know there are over 100 3BR/2BA houses under $250k that are within 3 miles of uptown?
Be creative!
Here are some options for homes under $200k that are in the sought-after Myers Park school district!
Get inside the mind of your potential buyers and post the searches you think might interest them.
2) Give the people what they want : stats!
Our IDX is loaded with great data. Let’s say you have a listing and you want to show that it’s a great deal. Post the “Market Check” page with all the nearby solds.
Or, if you’ve got our “Neighborhood Analyzer,” you can give great information about a neighborhood :
In Providence Plantation, sellers have taken about 3.5% less than list price in the past 3 months.
Or post a graph to *show* them:
Take advantage of the data! This is good stuff that buyers and sellers really want to know. Think of unique ways to present it and post it to your various sources : Twitter, Facebook, etc.
3) More is better
Our clients often ask us : how often should I blog, or tweet, or update Facebook? The answer : more is better. If you sell Lake Wylie, for example, the more good stuff you post about it, the more likely it is to be found. Buyers do a lot of searching online before they choose a Realtor, and if you’re the one posting the good stats and providing the best information, you have a better shot at getting that lead.
Mecklenburg County activity report (post-tax credit)
The infamous tax credit expired on April 30, and now the question is how many closings will we see, and what “move up” buyers will do after they sell their homes to buyers who took advantage of the tax credit.
Without further adieu…
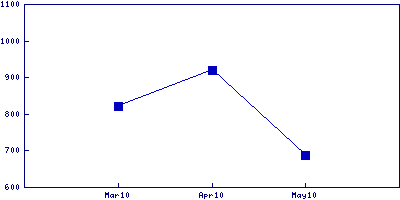
Houses+condos sold per month in Mecklenburg County
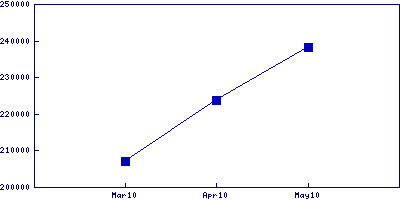
Average price of houses+condos sold in Mecklenburg County
As you can see, it’s a mixed bag. As of now (June 1, 2010), some of the sales from May might not have been reported yet, so it’s possible that number of 688 houses+condos sold in May will go up. But given how “thorough” most lenders are these days, it’s not entirely surprising that people who went under contract in late April might not have closed yet.
But the increase in average price certainly shows that values in the area are quite stable. As we’ve written before, Charlotte hasn’t seen the massive drops in value that other areas have seen, but activity remains low.
Certainly, with more “tax credit” closings to occur in the next 30 days, there is hope that some “move-up” buyers will start hitting the market in the next quarter. Fingers crossed!